


The Feds are at it again so how do we react and win?
An automotive perspective.

Are headwinds coming for Automotive? The New York Times reported that the Fed has been raising interest rates to make borrowing for big purchases — cars, houses, business expansions — more expensive. The goal is to raise unemployment to cool demand and slow the fastest inflation in four decades. Whether it can pull that off without inflicting severe pain on the economy will hinge partly on how easily companies surrender their hefty profits. What does that mean for automotive?

Overview: We will talk about the federal reserve's signaling for interest rates through the end of the year to curb inflation and why it's taking so long to fix. Then we will look at ways dealers are thinking to take advantage of this economy. Finally, we'll move into the used car retail market and finish with new cars.

Diving Deeper into the Details: It will likely take while for the federal government to get this looming inflationary environment under control because of the artificial economy built through stimulus. From 2005 to 2007, going into 2008, when the economy was strong, you see in the below graph the Fed's began raising interest rates to keep the economy under control. As the recession hit in late 2008 and 2009, the Fed dropped interest rates to combat the recession.
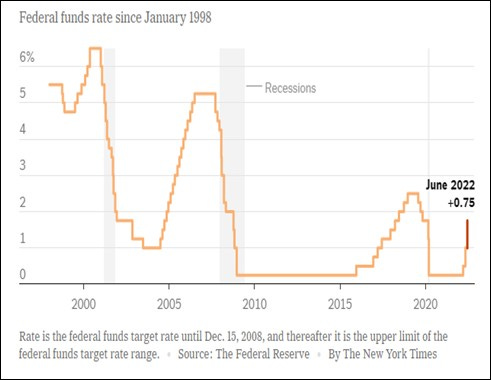
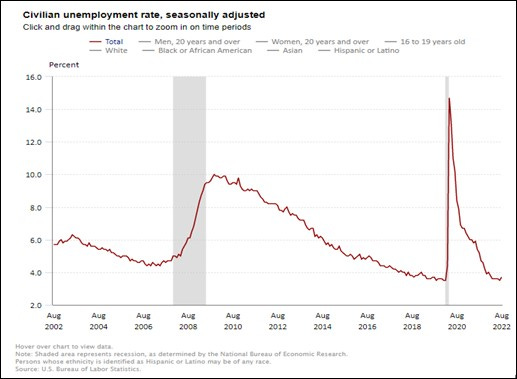
In 2020 when the pandemic hit, they decreased rates again to fight the recession, but also injected trillions of dollars into the economy through artificial stimulus. Because of that injection, we are in a perpetual state of high demand and low supply when we should be in a condition of low demand and low supply without the many stimulus packages. The Fed put themselves in a position where they will have to raise rates enough to curb that supply and wage growth to combat the demand side and soften prices. In the bottom graph, you can see unemployment is too low for our supply state. This signaling by the Feds suggests they want to increase unemployment to help combat inflation.
What are dealers saying? The good news is there is still pent-up demand on the sidelines. As retail prices soften going into 2023 tax season, we should see an opportunity to take advantage of that sidelined buyer motivated by the softening of prices.
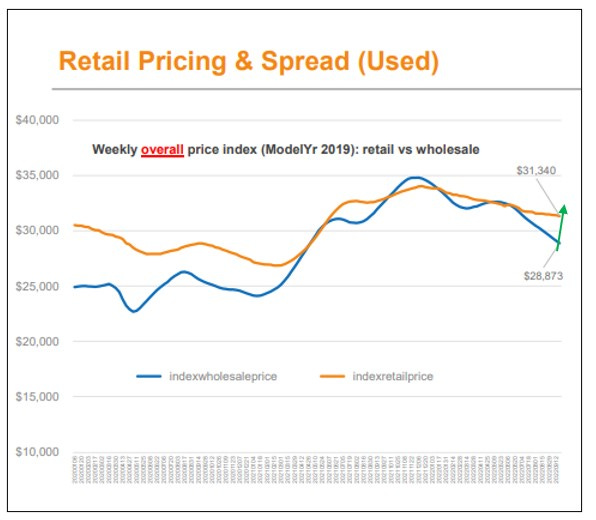
Talking with dealers this week, a common theme is they are holding too much water in their used car inventory set. Some of that could have been avoided by watching the right economic indicators weekly and pivoting quickly, but that is not an easy lift without help from industry partners. Many of the dealers I talked to say they are starting to use a first in, first out retail approach to take advantage of today’s profitable market (show with the green arrow below). This allows them to sell aged inventory for less profit or even a loss at times and offset some of that water as they right-size their set.
Blackbook.com is reporting that we will see better prices on cars in 2023, and some experts say that you might find a good deal as early as late fall/early winter of 2022. As in all economies, there are areas to win and take market share, and now is no different.
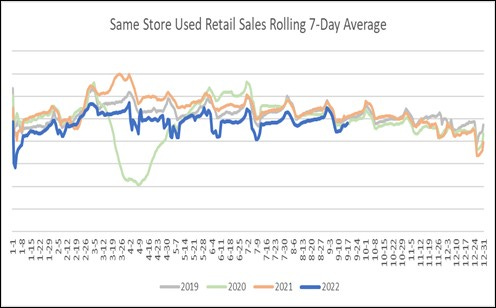
Can we predict the used market? Following the sales rate trends above and understanding historically how they've performed but more importantly how they're expected to perform by year's end, you can look at your day supply and get a good idea of ways to stay steady to sales rate. Is your sales rate performing at or better than the market? If so, you might reasonably expect the rest of the year to follow the graph trend as it has all year and set a forecasted buy plan. My good friend Jasen Rice, owner of LotPop, has a strict 30 day policy that is showing much success in his client base. His team would be a good partner in the fox hole. Couldn’t help it. That’s the Marine in me coming out.
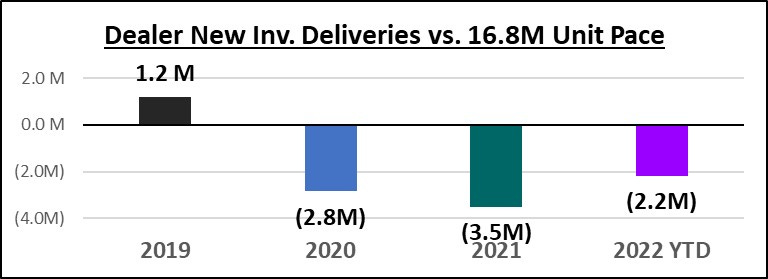
The new market has shown a resurgence lately: The trends tell the story but as you can see above we are still running a substantial deficit accumulated over the last 3 years. New car sales running is ~30% behind 2019 and 2020. Days' supply moved down to 40 days but is now running ahead of 2021 levels as inventory slowly increases.
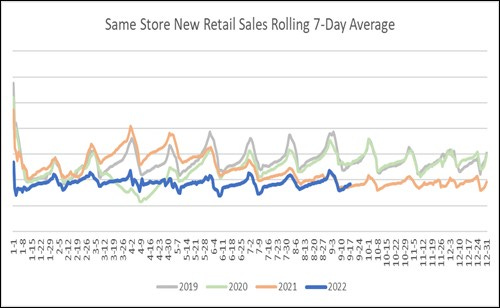
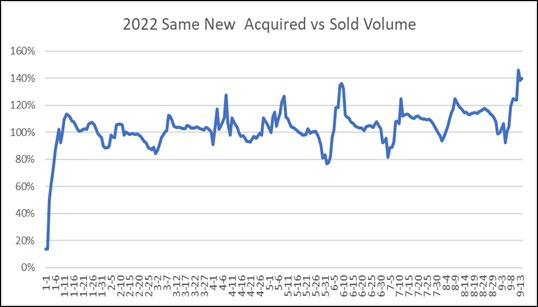
The same store's average sales rate is up a little bit, seen above, and that's because acquired versus sold allocation has increased almost to 142% last week but is down to 140% this week. You can see the trend of acquired versus sold in the graph below and watch if it declines over the next few weeks and months. That is a possibility due to the production problems we heard about late Q3.
What’s the bottom line. All of these economic measures and how they move will be a good indicator of how to set your strategy for 2023. No one has a crystal ball, and as we have seen we can be wrong as much as right. However, if we stay true to the fundamentals, and utilize industry partners for data and insights to help you guide the ship, we can pivot quickly and win in any environment.
Happy Selling
John Ellis, The BEV Guy
Automotive Industry Consultant