Used car sales took a big dip over the last week and that has implications for aging supply and inventory buy plans. There is more to the story than one week can tell. Take a look at this week’s report and reach out to The Automotive Advisor Team (www.automotiaveadvisorteam.com) for a deeper dive into the market, the automotive trends, and your 2023 year-ending strategy.
Economic Outlook SOURCE
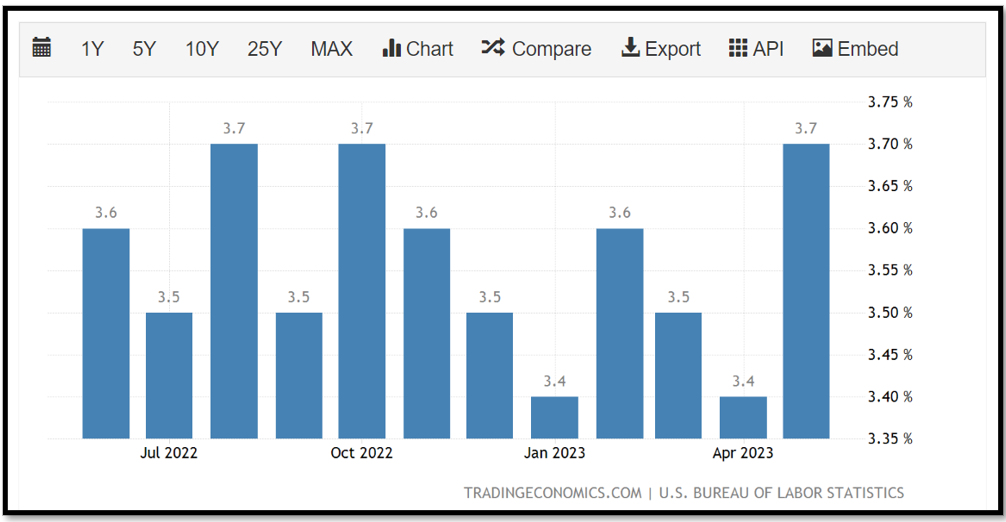
What’s the latest: The May Jobs report highlighted continued momentum in the labor market.
Why it Matters: However, divergent results from the household and establishment surveys warrant some skepticism toward the strong headline figures.
Bottom Line: Wage growth continued to moderate from its peak, rising by 4.3% y/y. Overall, recent data suggest that the labor market is softening, and inflation is still easing. As such, this report should not change the Fed’s plan to pause as the number of employed people fell by 310K and the unemployment rate rose to 3.7%. That is expected to keep the feds at bay through June
New Car Outlook
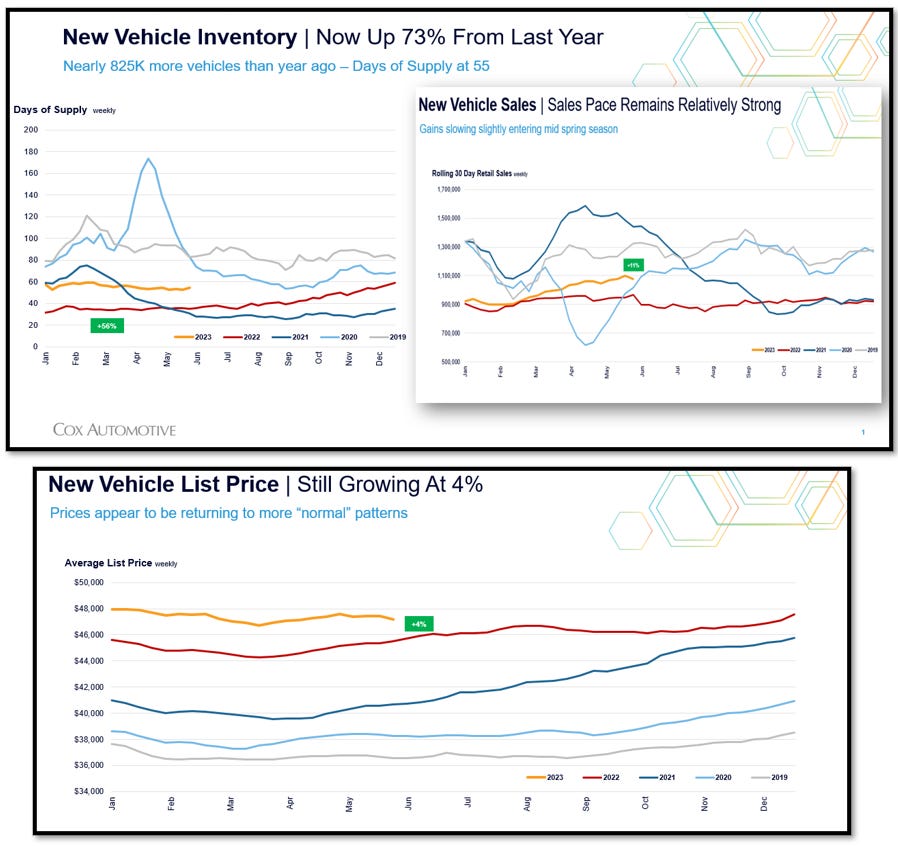
What’s the latest: Days of supply is 55, up two from last week. DS is stable and has remained in the mid-50s range for most of this year. DS is now 46% above last year
Why it Matters: Sold in last 30 Days is 1.08 million, down 23K from last week. Sales moved down this week pushing supply up. The sales pace is now running 11% above last year. The average Listing Price is $47,172, down $268 from last week. Prices in May are up 4-5% over last year and holding at near this growth level since February. However, the pace is slowing slightly over recent weeks
The Story in the Graphs: The first left graph below shows in the yellow line that day supply is holding steady weekly but up 73% from last year which is the red line below it. To the right, you the yellow line shows the trajectory of retail sales moderately above last year's number but starting to plateau. This tells us that new cars should remain steady, but affordability continues to be an issue with purchasers. At the bottom, you see retail prices above all prior years and staying strong, but trending down a little over the last few weeks.
Used Car Outlook:
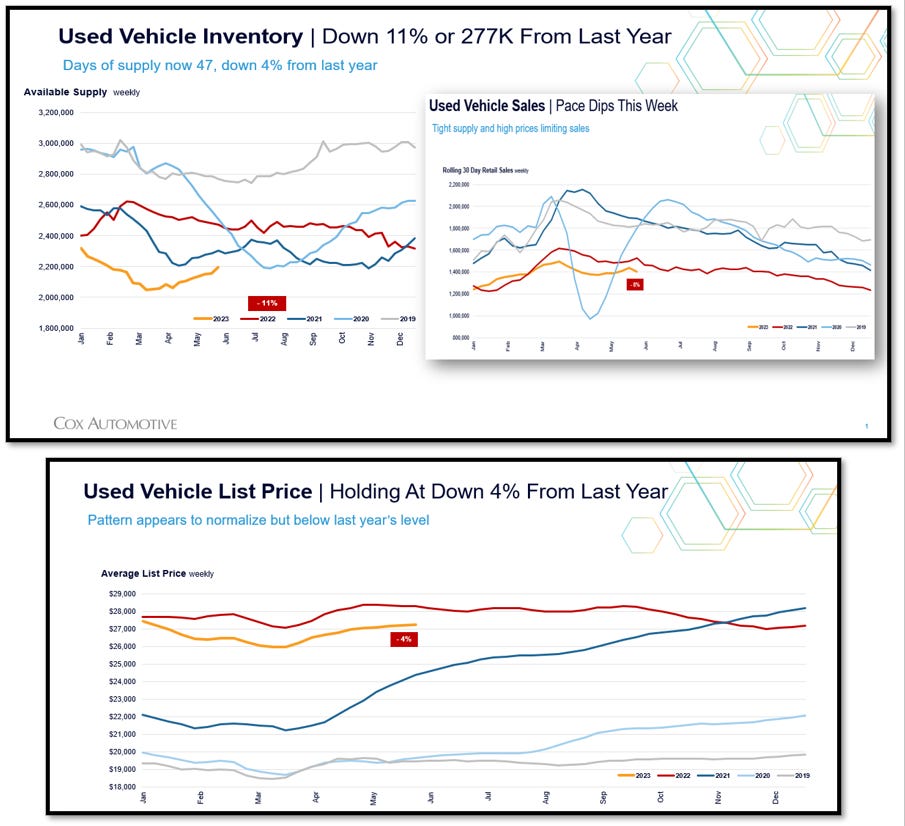
What’s the latest: Days of supply is 47, up two from last week. DS has been holding at this level for most of the spring and is now 4% below last year.
Why it Matters: Sold in last 30 Days is 1.41 million, down 30K from last week. The sales pace was seeing nice gains in early May but dipped and sales are now down 8% from last year. The average Listing Price is $27,256, up $61 from last week. Prices are holding steady down slightly from last year, but following “normal” patterns.
The Story in the Graphs: Looking top to bottom, the available supply of used inventory is on the rise, but still down 11% from last year. To the top right in the yellow line, you can see the used vehicle sales are staying steady and are above 2020 numbers but below 2023 numbers significantly. At the bottom you see the retail price holding steady and close to 2022 numbers and well above prior year numbers.
Wholesale Outlook:
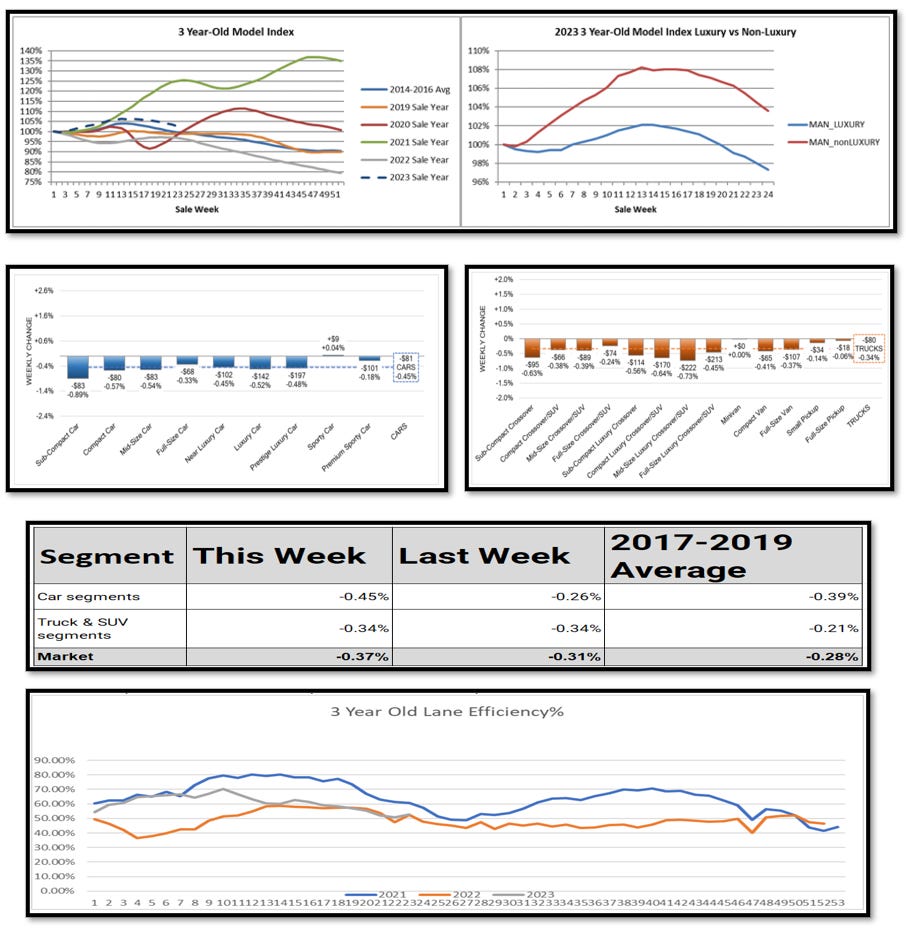
What’s the latest: The 3-year-old index depreciated 0.8% to 101.7%. Non-luxury decreased 0.9% and luxury decreased 0.7%. All model years depreciated week over week. Five and six-year-old models depreciate the least.
Why it Matters: After the holiday weekend, the lane efficiency increased, shown in the bottom graph. That suggests dealers had a good holiday weekend and are now buying up inventory for replenishment.
The Story in the Graphs: Reading from top to bottom, Top left vehicle valuations are still on the decline. The top right shows non-luxury dropping faster than luxury. The second set of graphs shows all segments except sports cars and minivans are declining. The next graph shows relative segment value from last week to this week revealing a consistent declining trend. The final graph shows auction sales efficiency is increasing above 50% after the holiday weekend with dealers trying to fill their lots back up.
Retail Margin Outlook
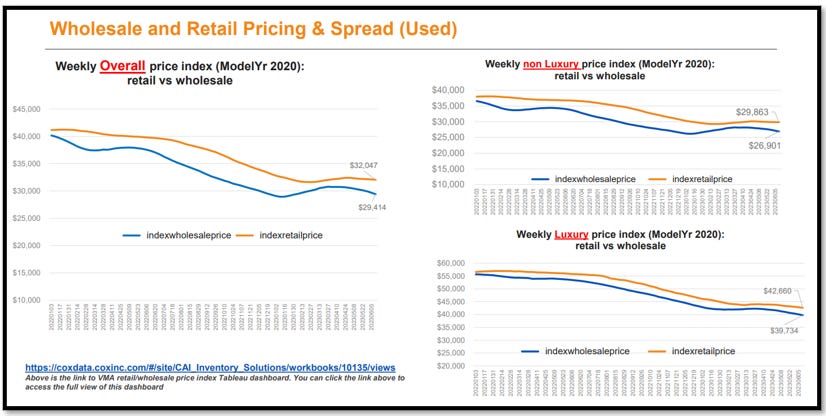
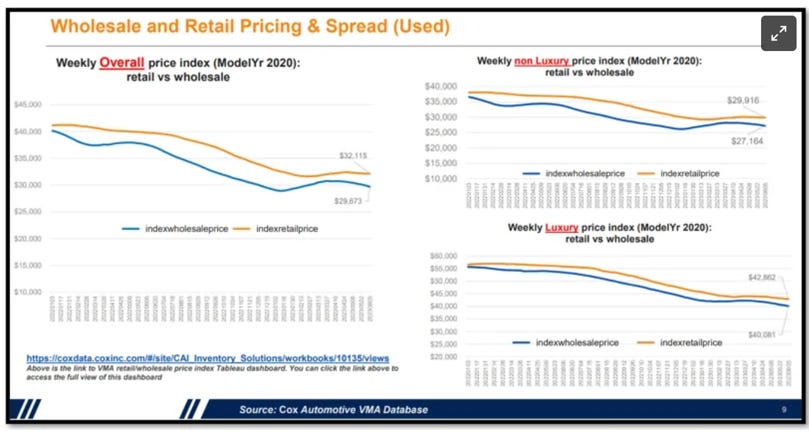
What’s the latest: Average retail price dropped $68 for a Model Year 2020.
Why it Matters: But the average wholesale value dropped $249 for MY 2020.
The Story in the Graphs: That again reveals margin growth continues in the spread shown below between the Retail Market index from vAuto in orange and the MMR index in blue. Said another way, the value of the acquisition is dropping faster than the sale price of the same model year. Last Week we had a $464 gain and this week we have a $181 gain. So, although the market’s dropping, there are still margin opportunities in the wholesale acquisition channel.
This Week
Last Week:
Summary
All our dealer visits and conversations this week reveal that the market is slowing and dealers are having a harder time bringing customers in to buy vehicles. Whether it be affordability, credit, negative equity, or simply that consumers are pulling back due to economic conditions outside of automotive, many operations are getting nervous and creating unique ways to retail inventory.
Looking closer you can see the market still has many growth opportunities. The only requirement is calculated courage based on fresh relevant data that reveals an execution strategy in the face of adversity. Reach out to the AA team at our website or email below to discuss your strategy and growth opportunities.
The Automotive Advisor Team
www.theautomotiveadvisorteam.com
info@theautomotiveadvisorteam.com


